ICICI Prudential Value Fund (erstwhile Value Discovery Fund) - Growth
ICICI Prudential Value Fund (erstwhile Value Discovery Fund) - Growth
Fund Manager : Sankaran Naren, Dharmesh Kakkad, Masoomi Jhurmarvala | Benchmark : Nifty 500 TRI | Category : Equity: Value
NAV as on 16-07-2026
AUM as on 30-06-2026
Rtn ( Since Inception )
19.12%
Inception Date
Aug 05, 2004
Expense Ratio
1.4%
Fund Status
Open Ended Scheme
Min. Investment (Rs)
1,000
Min. Topup (Rs)
500
Min. SIP Amount (Rs)
100
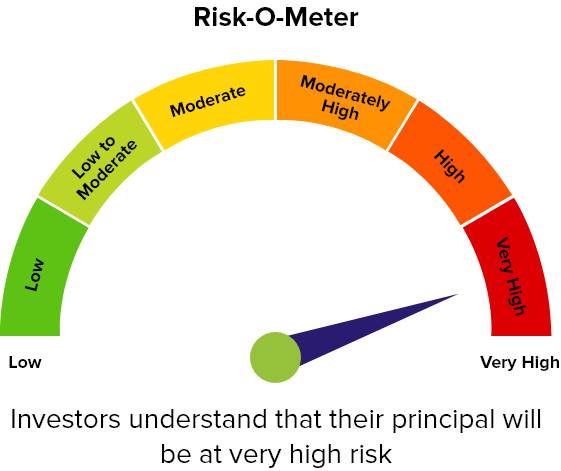
Risk Status
very high
Investment Objective : To generate returns through a combination of dividend income and capital appreciation by investing primarily in a well-diversified portfolio of value stocks. However, there can be no assurance or guarantee that the investment objective of the Scheme would be achieved.
Returns (%)
| 1 Mon (%) | 3 Mon (%) | 6 Mon (%) | 1 Yr (%) | 3 Yrs (%) | 5 Yrs (%) | 10 Yrs (%) | |
|---|---|---|---|---|---|---|---|
| Fund | 0.32 | -0.53 | -5.69 | -2.16 | 14.51 | 16.21 | 14.14 |
| Benchmark - NIFTY 500 TRI | 1.23 | 2.95 | -0.57 | -0.07 | 12.52 | 12.19 | 13.66 |
| Category - Equity: Value | 1.45 | 3.23 | 0.88 | 1.18 | 14.4 | 13.43 | 13.52 |
| Rank within Category | 19 | 21 | 21 | 14 | 9 | 2 | 5 |
| Number of Funds within Category | 22 | 22 | 22 | 22 | 21 | 17 | 12 |
Returns less than 1 year are in absolute and Returns greater than 1 year period are compounded annualised (CAGR)
Equity Holdings (Top 10)
| Sector | Allocation (%) |
|---|
Sector Allocation (%)
Asset Allocation
| Asset Class | Allocation (%) |
|---|---|
| Equity | 95.56 |
| Debt | 1.57 |
| Cash & Cash Equivalents | 2.86 |
| Derivatives | 0.19 |
Portfolio Behavior
| Mean | 16.08 |
| Sharpe Ratio | 0.8 |
| Alpha | 3.28 |
| Beta | 0.79 |
| Standard Deviation | 13.17 |
| Sortino | 1.27 |
| Portfolio Turnover | 0.87 |
Market Cap Distribution
Yearly Performance (%)
Standard Performance
Riskometer
SIP Returns (Monthly SIP of Rs. 10,000)
| 3 Year | 5 Year | 10 Year | 15 Year | |||||||||
|---|---|---|---|---|---|---|---|---|---|---|---|---|
| Scheme Name | Invested Amt | Current Value | XIRR (%) | Invested Amt | Current Value | XIRR (%) | Invested Amt | Current Value | XIRR (%) | Invested Amt | Current Value | XIRR (%) |
| ICICI Pru Value Fund Gr | 360,000 | 391,211 | 5.79 | 600,000 | 817,773 | 12.75 | 1,200,000 | 2,766,819 | 16.17 | 1,800,000 | 6,910,702 | 16.45 |
| NIFTY 500 TRI | 360,000 | 394,606 | 6.4 | 600,000 | 781,092 | 10.84 | 1,200,000 | 2,440,655 | 13.8 | 1,800,000 | 5,545,652 | 13.9 |
| Equity: Value | 360,000 | 397,840 | 6.91 | 600,000 | 808,552 | 12.22 | 1,200,000 | 2,517,382 | 14.3 | 1,800,000 | 5,976,423 | 14.69 |
Returns less than 1 year are in absolute and greater than 1 year are compounded annualised (CAGR). SIP returns are shown in XIRR (%).
The Risk Level of any of the schemes must always be commensurate with the risk profile, investment objective or financial goals of the investor concerned. Mutual Fund Distributors (MFDs) or Registered Investment Advisors (RIAs) should take the risk profile and investment needs of individual investors into consideration and make scheme(s) or asset allocation recommendations accordingly.
Mutual Fund investments are subject to market risks, read all scheme related documents carefully. Past performance may or may not be sustained in the future. Investors should always invest according to their risk appetite and consult with their mutual fund distributors or financial advisor before investing.